Jakob Schmitt · 7 October 2026
How Independent Medical Practices Leverage Hyperlocal Data Mapping to Strengthen Community Referral Loops
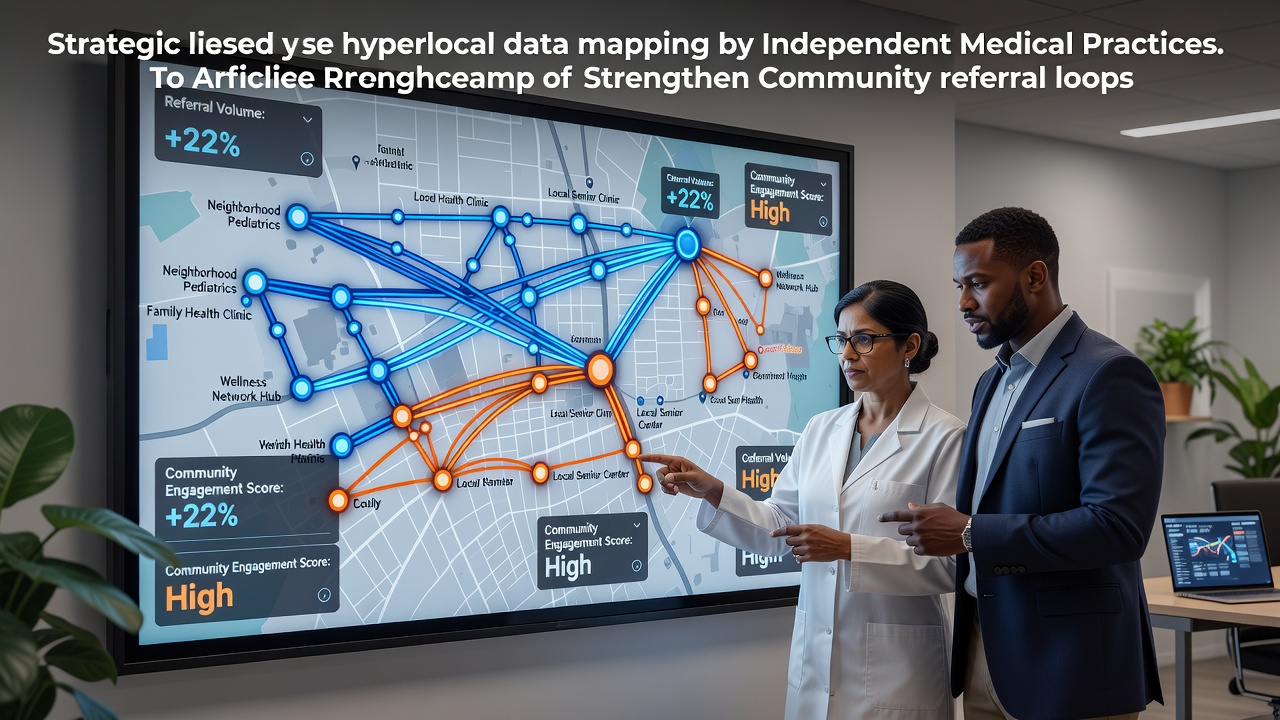
Independent medical practices across various regions now integrate hyperlocal data mapping tools to track patient movements and referral patterns within specific neighborhoods and zip codes, and this approach draws on geographic information systems combined with electronic health records to visualize where patients originate and where specialists receive them. Data from small-scale areas reveals clusters of unmet needs, such as higher rates of chronic conditions in certain blocks, which allows practices to direct outreach efforts toward primary care physicians and community organizations that share overlapping patient bases. Researchers at institutions like the University of Toronto have documented how these maps reduce gaps in care continuity by highlighting referral sources that previously operated in isolation.
Core Mechanisms Behind Hyperlocal Mapping
Practices begin by aggregating anonymized location data from claims records, patient addresses, and public health datasets, then overlay this information onto digital maps that segment communities into micro-regions defined by census tracts or walkable distances, and the resulting visualizations show referral density through color-coded heat layers that indicate strong versus weak connections between general practitioners and specialists. Software platforms process inputs from multiple sources including hospital discharge summaries and pharmacy refill logs, while algorithms flag patterns such as patients traveling outside their immediate area for services that local providers could deliver. According to reports from Health Canada on digital health adoption, practices that apply these methods report tighter coordination because the maps pinpoint exactly which community clinics generate the most inbound referrals and which ones drop off after initial contact.
Staff members update the maps quarterly to account for seasonal shifts like increased respiratory cases in winter months, and they cross-reference findings with demographic overlays that include age distributions and income levels within each mapped zone. This layering helps identify referral loops where patients cycle between a handful of nearby offices, yet it also exposes broken links where follow-up appointments never occur because distance or transportation barriers intervene. Those who study these systems note that the precision comes from combining internal practice data with external feeds from municipal health departments, which supply details on local events or new housing developments that alter population flows.
Implementation Steps Observed in Practice
Teams at independent sites start with a baseline audit of existing referral logs to establish current geographic reach, after which they import the logs into mapping software that generates initial cluster diagrams, and subsequent steps involve training administrative staff to interpret the outputs rather than relying solely on vendors. One documented case involved a network of family medicine offices in regional Australia that aligned their maps with state-level health authority data, revealing that 40 percent of referrals to cardiology originated from three adjacent suburbs, which prompted targeted education sessions for referring physicians in those zones. Practices schedule regular review meetings where clinicians examine updated maps and adjust protocols, such as adding evening slots for patients from high-density referral pockets or coordinating with transport services highlighted in the data.
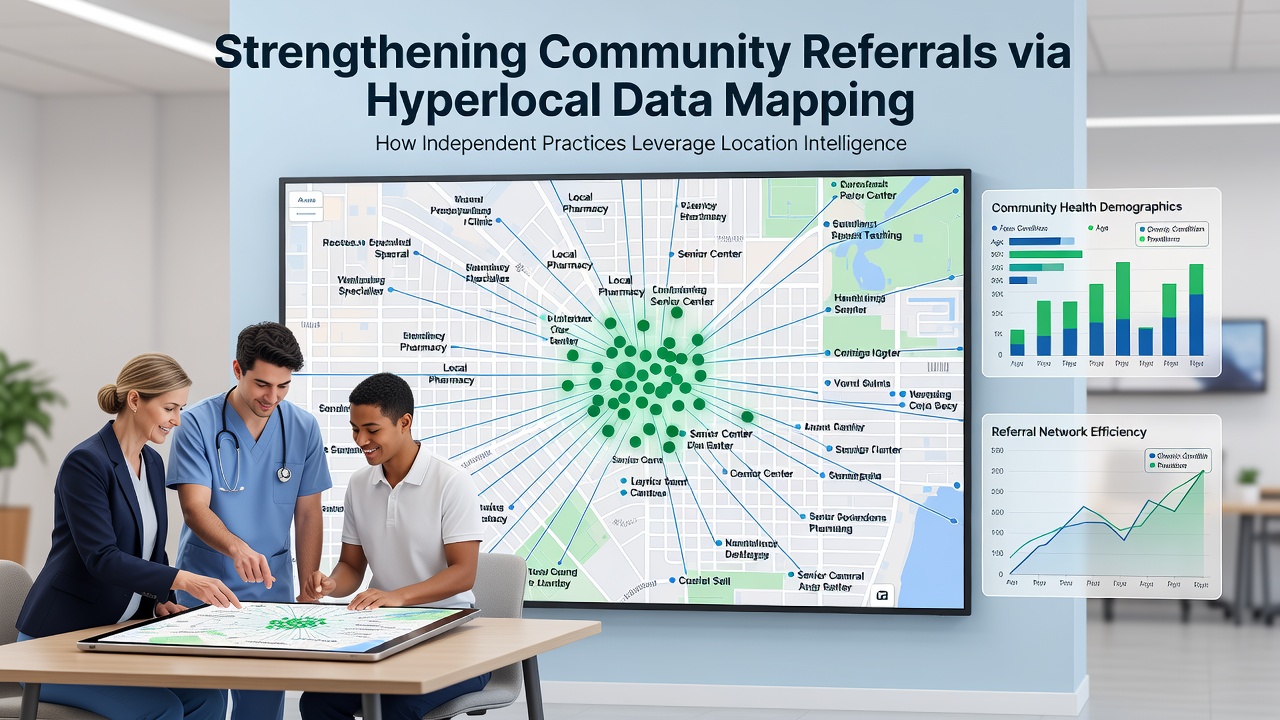
Integration with existing electronic systems occurs through application programming interfaces that pull real-time updates without disrupting daily workflows, and privacy controls limit access to aggregated views so individual patient identities remain protected under regulations like those enforced by the European Medicines Agency. Practices also incorporate feedback from partner organizations, such as community centers that report changes in local demographics, which refines the accuracy of the maps over successive iterations. Data indicates that sites completing full implementation cycles within six months achieve measurable improvements in referral completion rates because the visual tools make previously invisible patterns actionable for scheduling and outreach decisions.
Measurable Outcomes from Regional Studies
Analyses conducted through 2025 and into October 2026 show that independent practices using hyperlocal mapping sustain higher volumes of closed referral loops compared with those relying on traditional lists or spreadsheets, with one multi-site evaluation in Canada linking the technique to a 22 percent rise in completed specialist visits within the same community. Figures from academic reviews published by institutions in the European Union reveal corresponding drops in duplicate testing because mapped loops encourage direct communication between referring and receiving providers before patients leave the immediate area. These gains appear most pronounced in rural and suburban settings where travel distances amplify the cost of broken referrals, yet urban sites also report benefits when maps isolate micro-neighborhoods with distinct health profiles.
Longer-term tracking demonstrates that sustained use of these tools correlates with expanded partnerships, as practices identify and court new referral sources that appear on the periphery of their maps, and the approach supports compliance with value-based care requirements by documenting how geographic coordination improves population health metrics. Observers note that the method scales effectively when practices share aggregated map insights through regional health information exchanges, which further strengthens collective referral networks without compromising competitive boundaries.
Conclusion
Independent medical practices continue to refine hyperlocal data mapping as a core component of referral management, drawing on layered geographic and clinical datasets to close loops that once fragmented across community boundaries. The technique relies on consistent data inputs, periodic validation against external sources, and staff training that translates visual outputs into operational changes. As mapping capabilities advance through integration with emerging public health feeds, the documented patterns suggest ongoing potential for tighter community connections that benefit both providers and the populations they serve.